| Scope |
| Requirements for comparison |
| Inputs |
| Reference case, STF45 |
| Complete list of crystal and beam parameters |
The analysis of data from the H8 beam tests for bent crystals has been performed, within the framework of the UA9 experiment. All crystals tested in the runs 2010-2012 have been consistently analyzed with the same analysis tools.

The inputs should be used to simulate the interaction of 400 GeV protons with a bent crystal (θc ∼10 μrad).
In particular, at the least for the reference crystal, STF45, the following experimental results should be reproduced by simulations tools with a minimum statistics of 106 particles:
With the characteristic of the reference crystal, simulation tools should reproduce the rate of nuclear interaction events as a function of the impact angle.
Nuclear interaction events are defined in this article.
Simulation code developers shall reproduce the same plot as in the article.
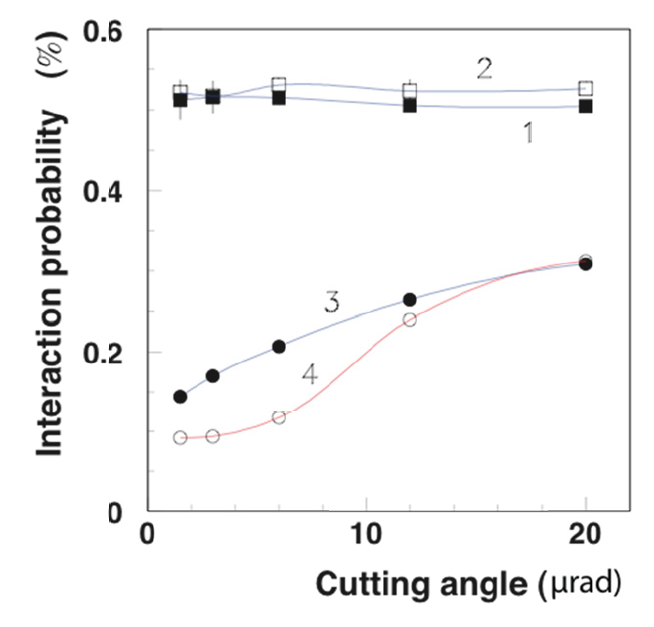
The dependencies of the inelastic nuclear interaction probability of protons in the crystal on the value of the cutting angle θcut of the incident beam for the amorphous orientation (1), for the case of volume reflection (2) and in the channeling orientation (3). The dependence (4) was obtained by simulation for the channeling oriented crystal.
| W. Scandale et al. | Probability of inelastic nuclear interactions of high-energy protons in a bent crystal NIM B 268 (2010) 2655-2659 |
Inputs for simulation of the interaction of 7 TeV protons with a bent crystal are provided, in order to compare the simulation routines at higher energy.
For the comparison at high energy the calculation of the following quantities is required:
The crystal characteristics are its length and its bending radius, where the length is provided by the manufacturers and the bending radius is determined by measuring the channeling angle.
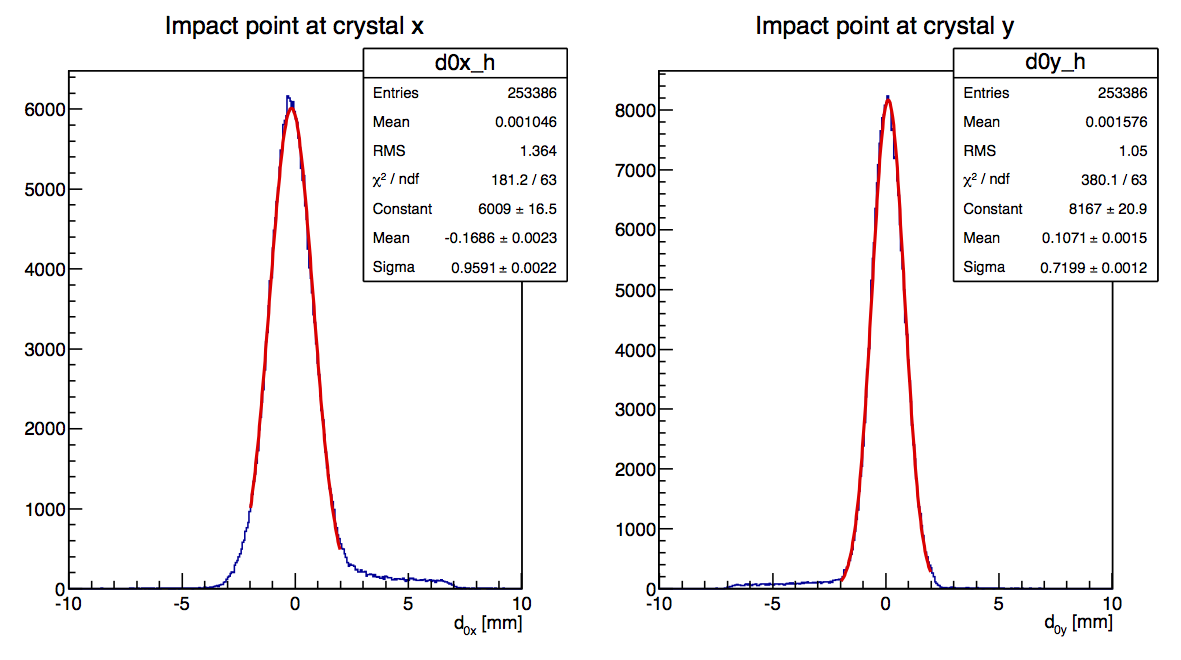
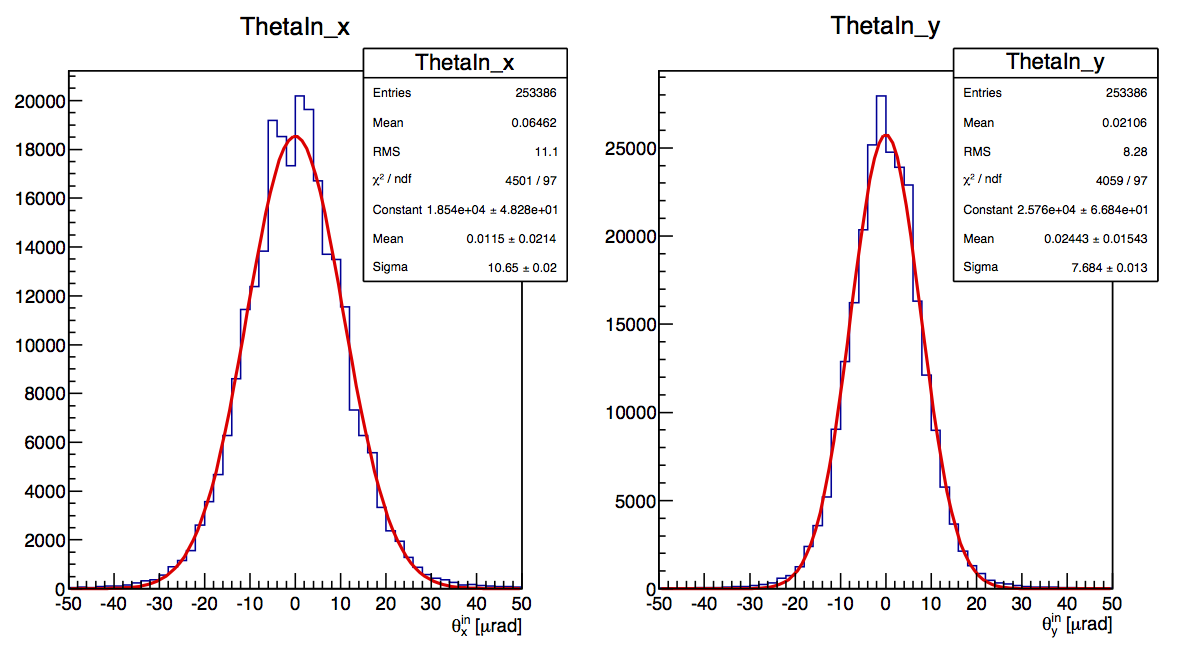
The beam characteristics were measured by means of alignment run performed without crystal in the line.
Beam gaussian profile and beam gaussian divergence were measured and are provided as inputs.
Inputs to simulate the reference case STF45 are:
| Crystal | Bending angle [μrad] | Lenght [mm] | Bending Radius [m] |
|---|---|---|---|
| STF45 | 143.78 ± 0.07 | 2.0 | 13.91 ± 0.01 |
| Crystal | Beam Profile [mm] | Beam Divergence [μrad] | ||||||
|---|---|---|---|---|---|---|---|---|
| μ_x | σ_x | μ_y | σ_y | μ_x' | σ_x' | μ_y' | σ_y' | |
| STF45 | -0,16 | 1,00 | 0,14 | 0,72 | 0,15 | 10,68 | 0,02 | 7,70 |
Inputs for the simulations at 7 TeV are provided.
The crystal is an LHC-like crystal. Beam parameters the same as provided for the STF45 can be assumed.
| Crystal | Bending angle [μrad] | Lenght [mm] | Bending Radius [m] |
|---|---|---|---|
| LHC-like | 50.00 | 4.0 | 80.00 |
The measurement of STF45 has been selected for comparison with crystal routines.
In the following, its complete analysis, the definition of the experimental measurements, and the reference plots for the comparison are presented.
For 400 GeV particles the critical impact angle for channeling is θc ∼ 10 μrad.
This analysis is performed by selecting only single track events which are impacting on the crystal face. Geometrical cuts and torsion corrections are performed prior to the channeling analysis.
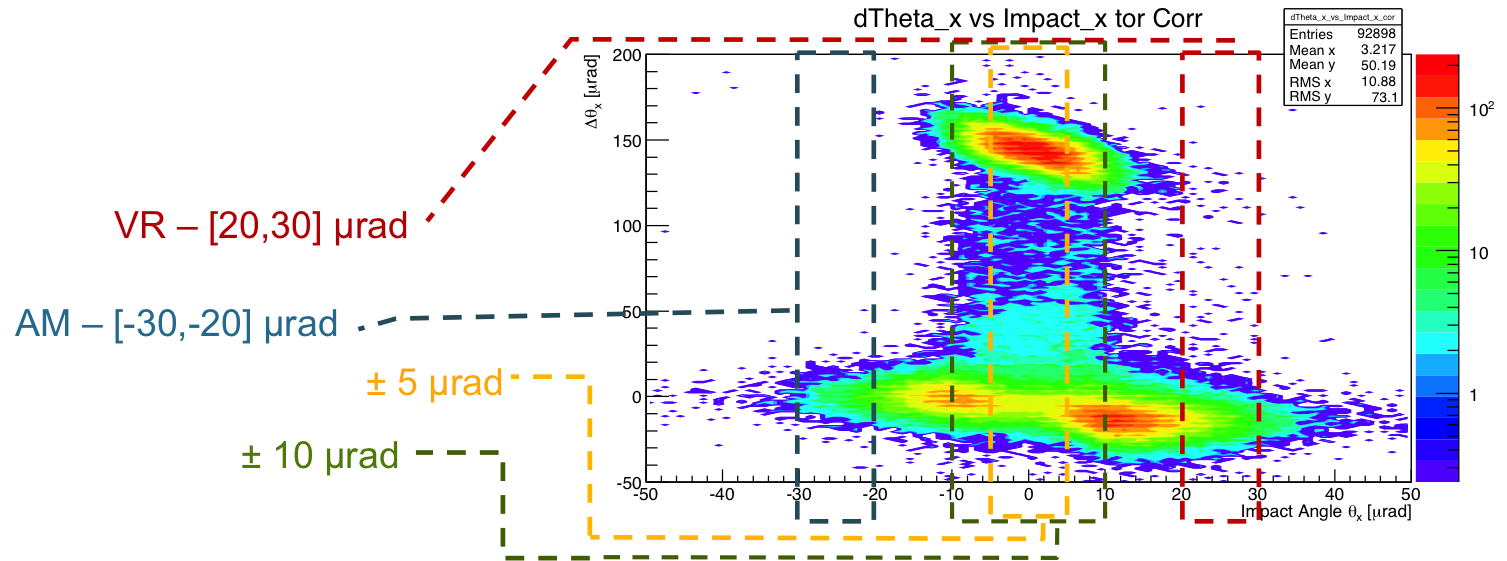
We analyize the deflection given to the particle by the interaction with the crystal as a function of the incoming angle of patricle at the crystal position.
The plot is produced:
.png)
Description of impact angle cut for next plots
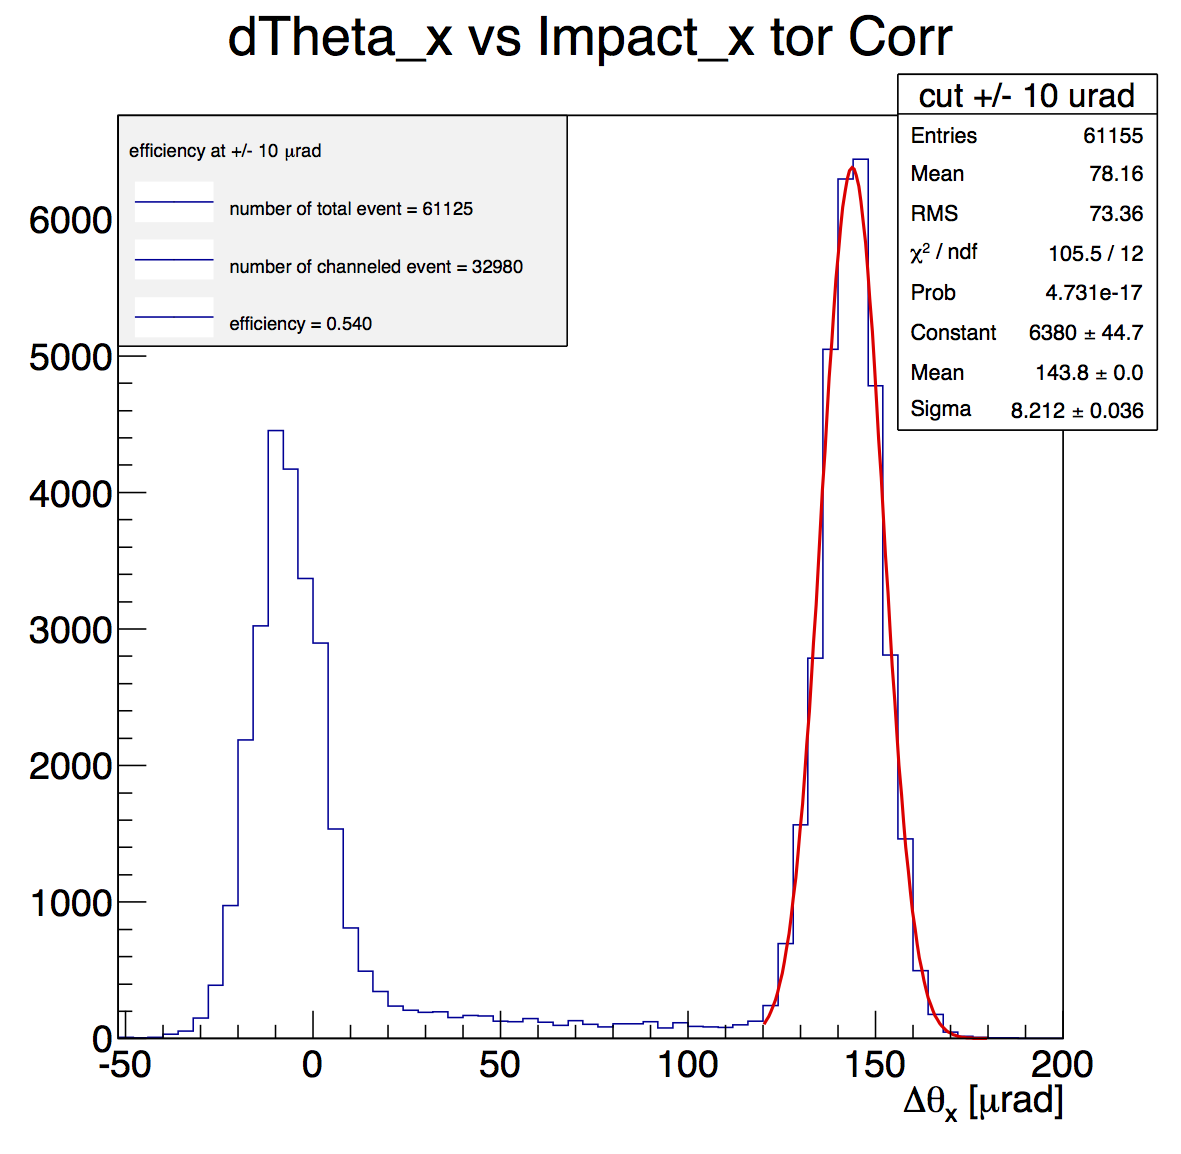
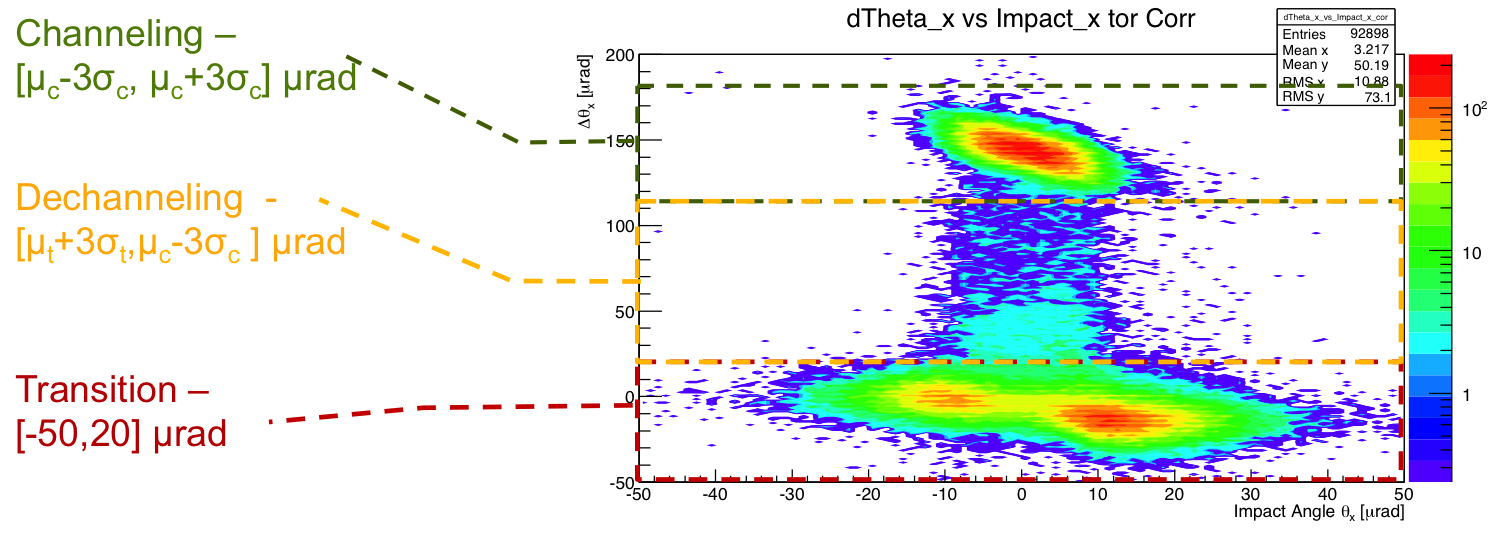
The deflection region, channeling dechanneling and transition region, are shown in the next plot.
In the plot μ and σ are the mean value and the sigma value of the gaussian fit, respectively , and the subsripts "c" and "t" refears to channeling and transition region fit, respectively.
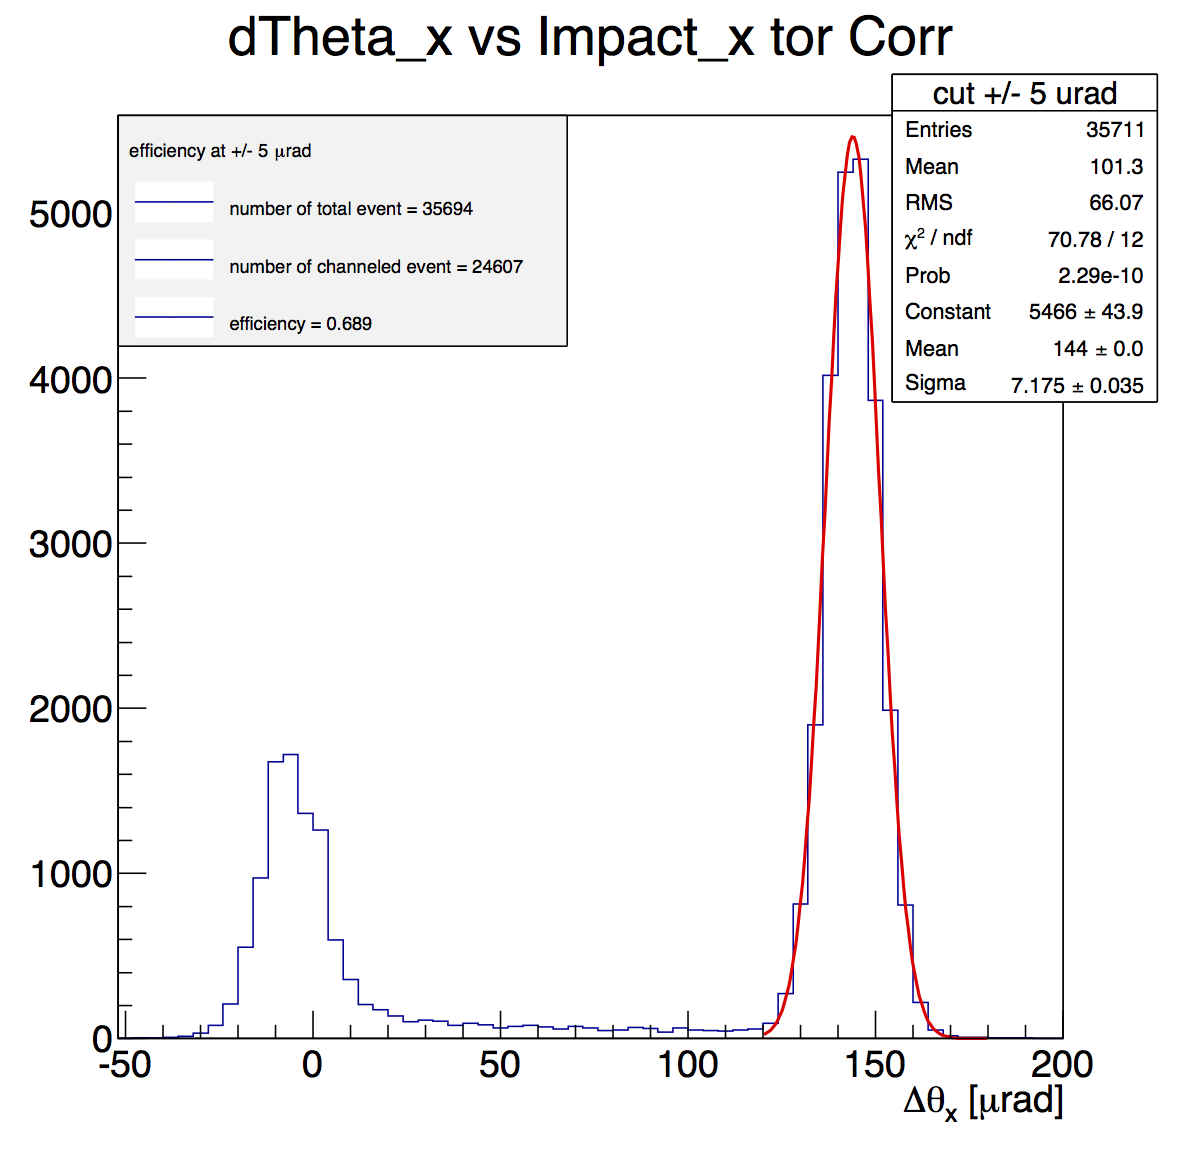
The channeling angle can be measured from this plot by selecting particles with impact angle of ± 5.0 μrad and at ± 10.0 μrad.
A gaussian fit on the channeling peak gives the bending angle and its sigma.
See the plot in the Channeling efficiency section.
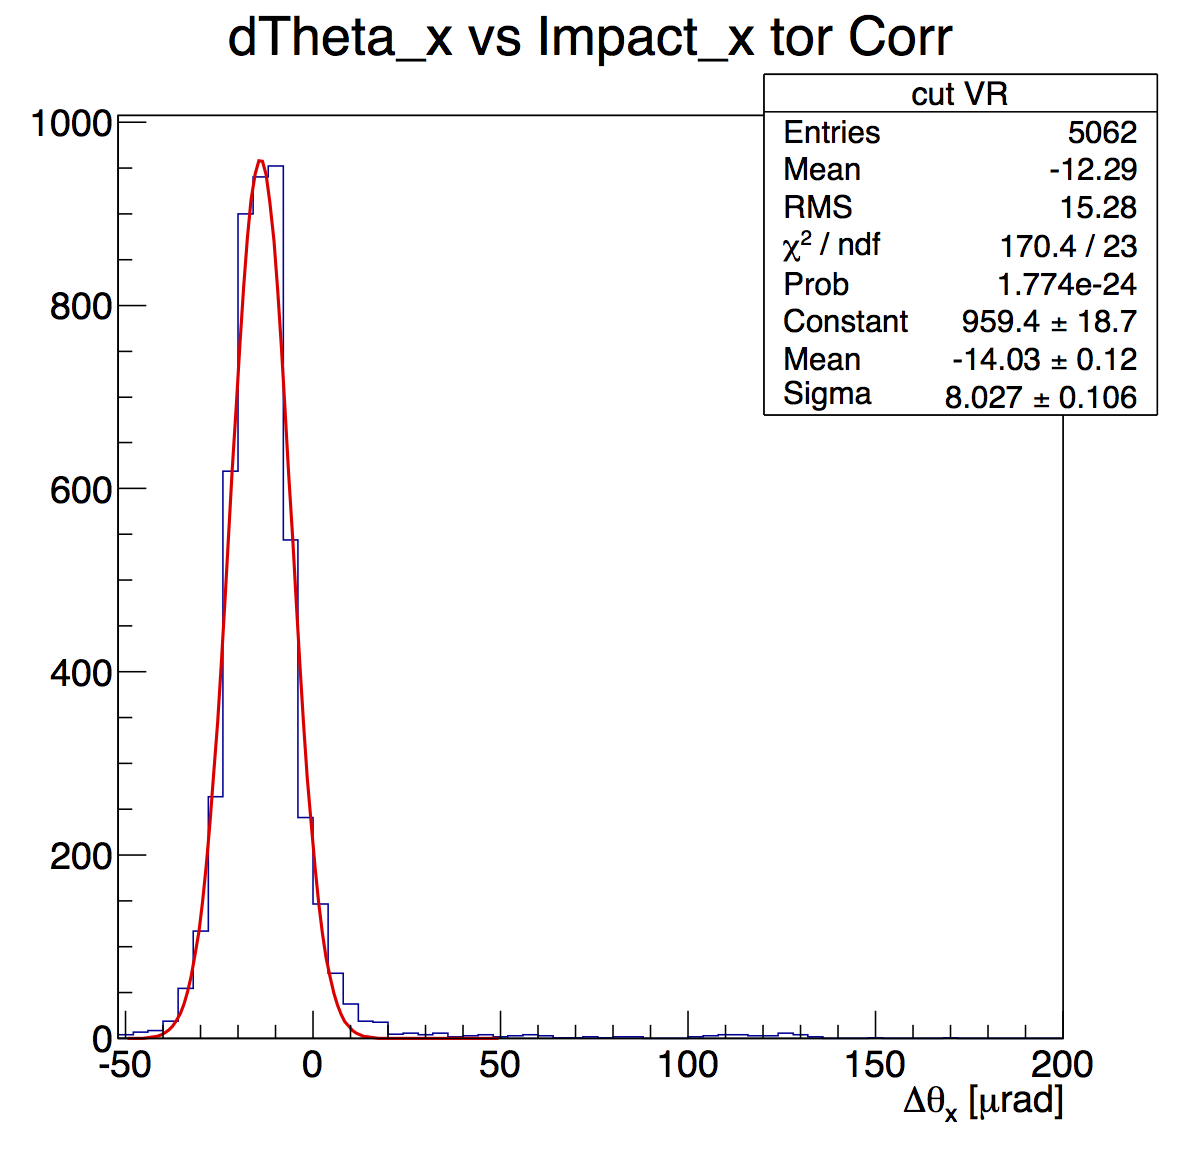
Selecting the particles with an impact angle in the range [+2θc,+3θc] a gaussian fit gives the volume reflection angle and its distribution sigma.
The volume reflection angle obtained is -14.03 μrad with a sigma of 8.03 μrad.
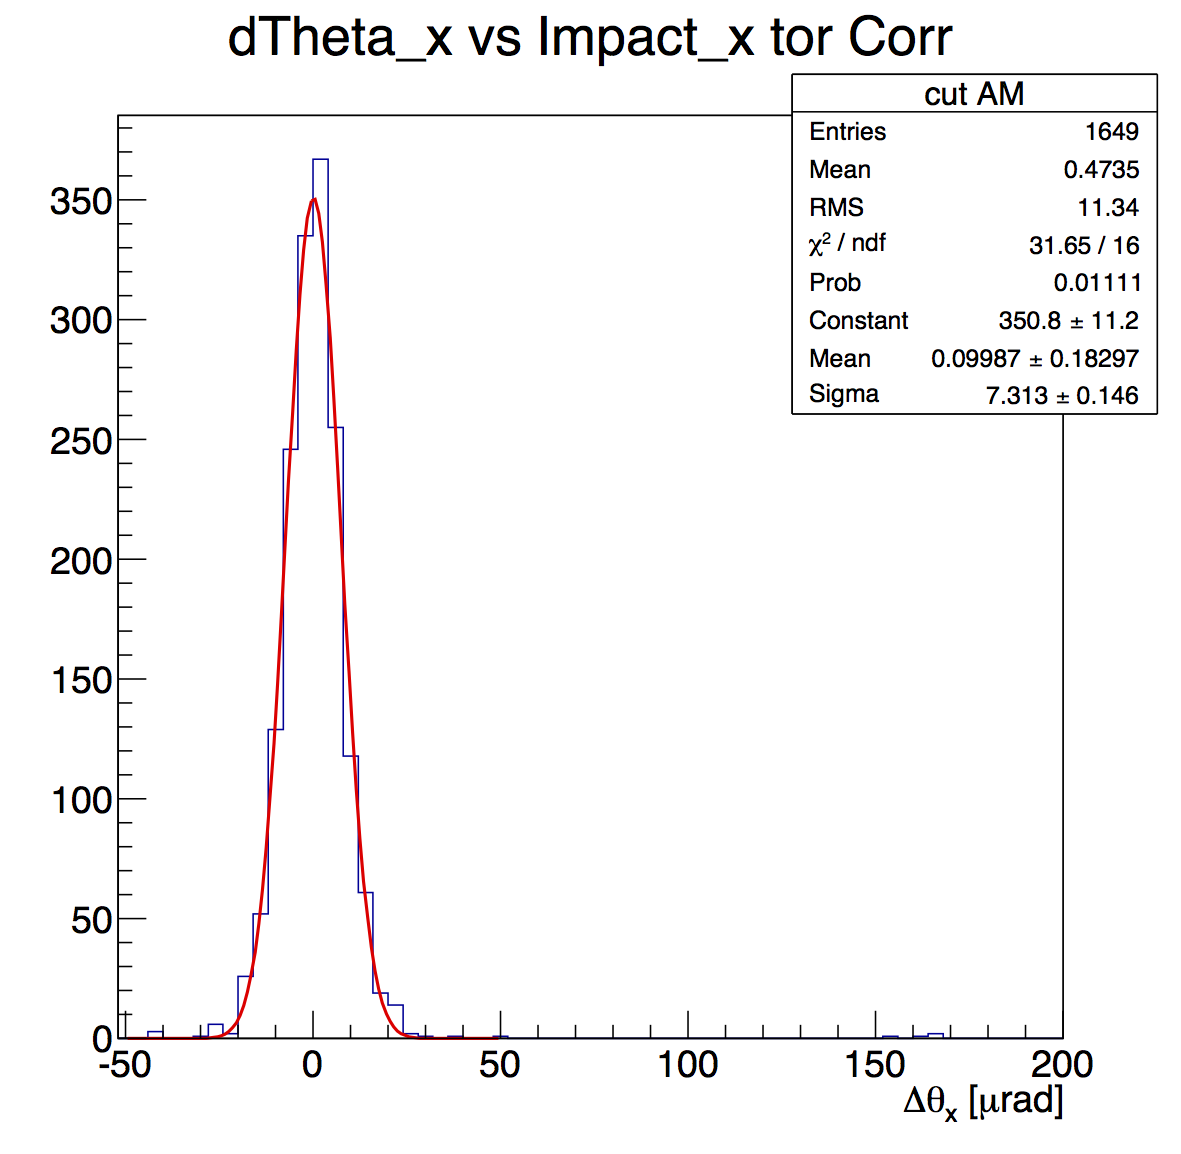
Selecting the particles with an impact angle in the range [-3θc, -2θc] a gaussian fit gives the amorphous distribution mean and its sigma.
The amorphous distribution has a mean value in 0.1 μrad with a sigma of 7.31 μrad.
The channeling efficiency is calculated as the ratio between the number of particles in channeling and the total number of particle. All the particle inside the peak (within 3σ) are considered in channeling. Different values for the impact angle cut are considered: an angular cut of ± 5.0 μrad yields a channeling efficiency of 0.69 whilst an angular cut of ± 10.0 μrad gives a channeling efficiency of 0.53.
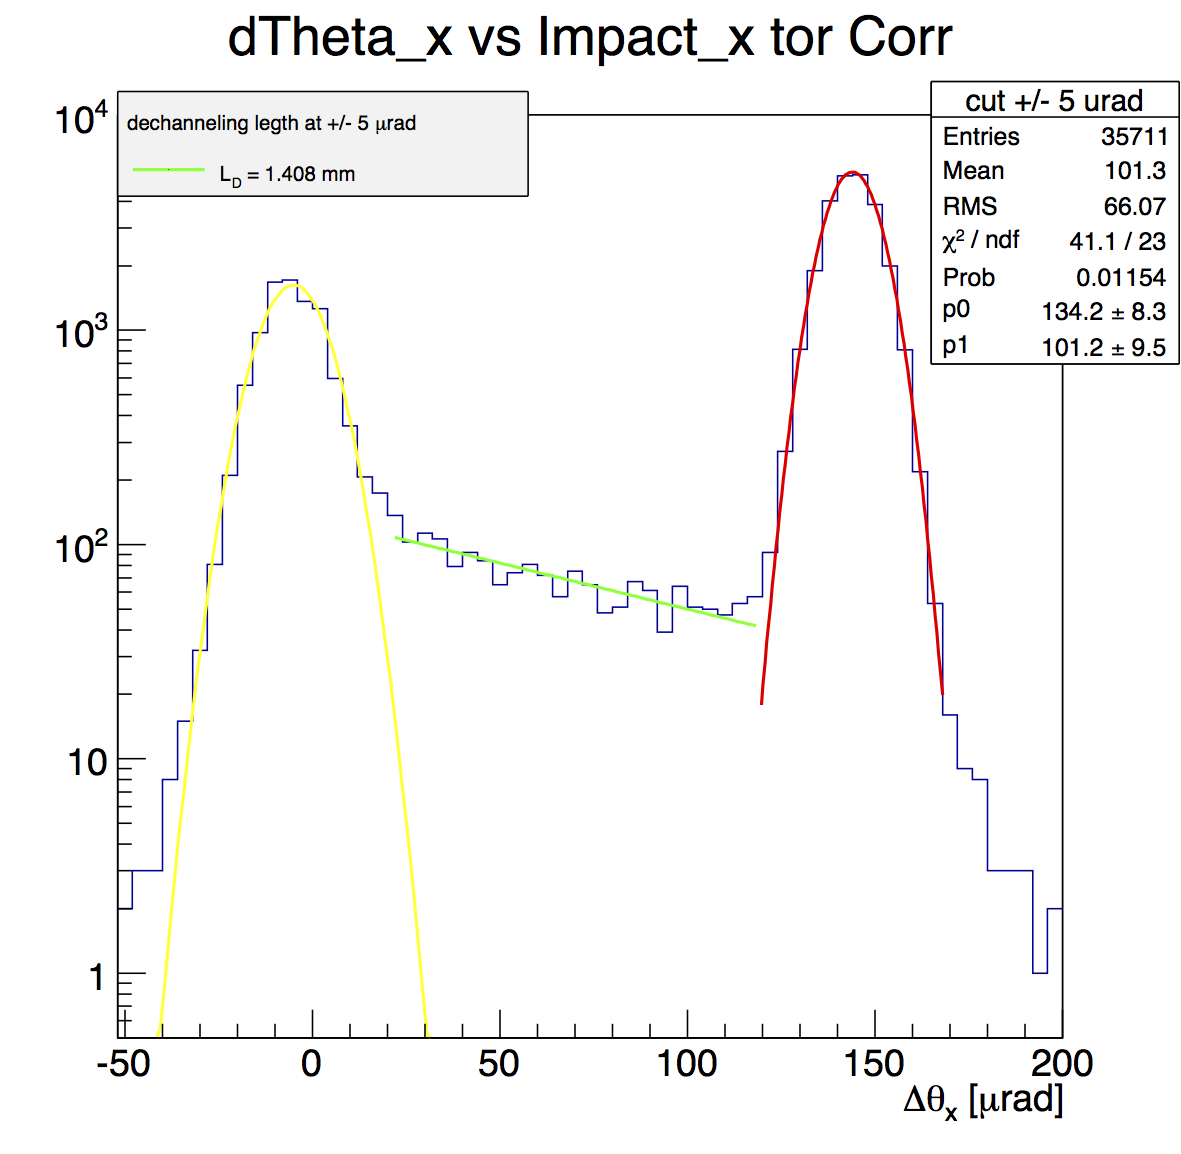
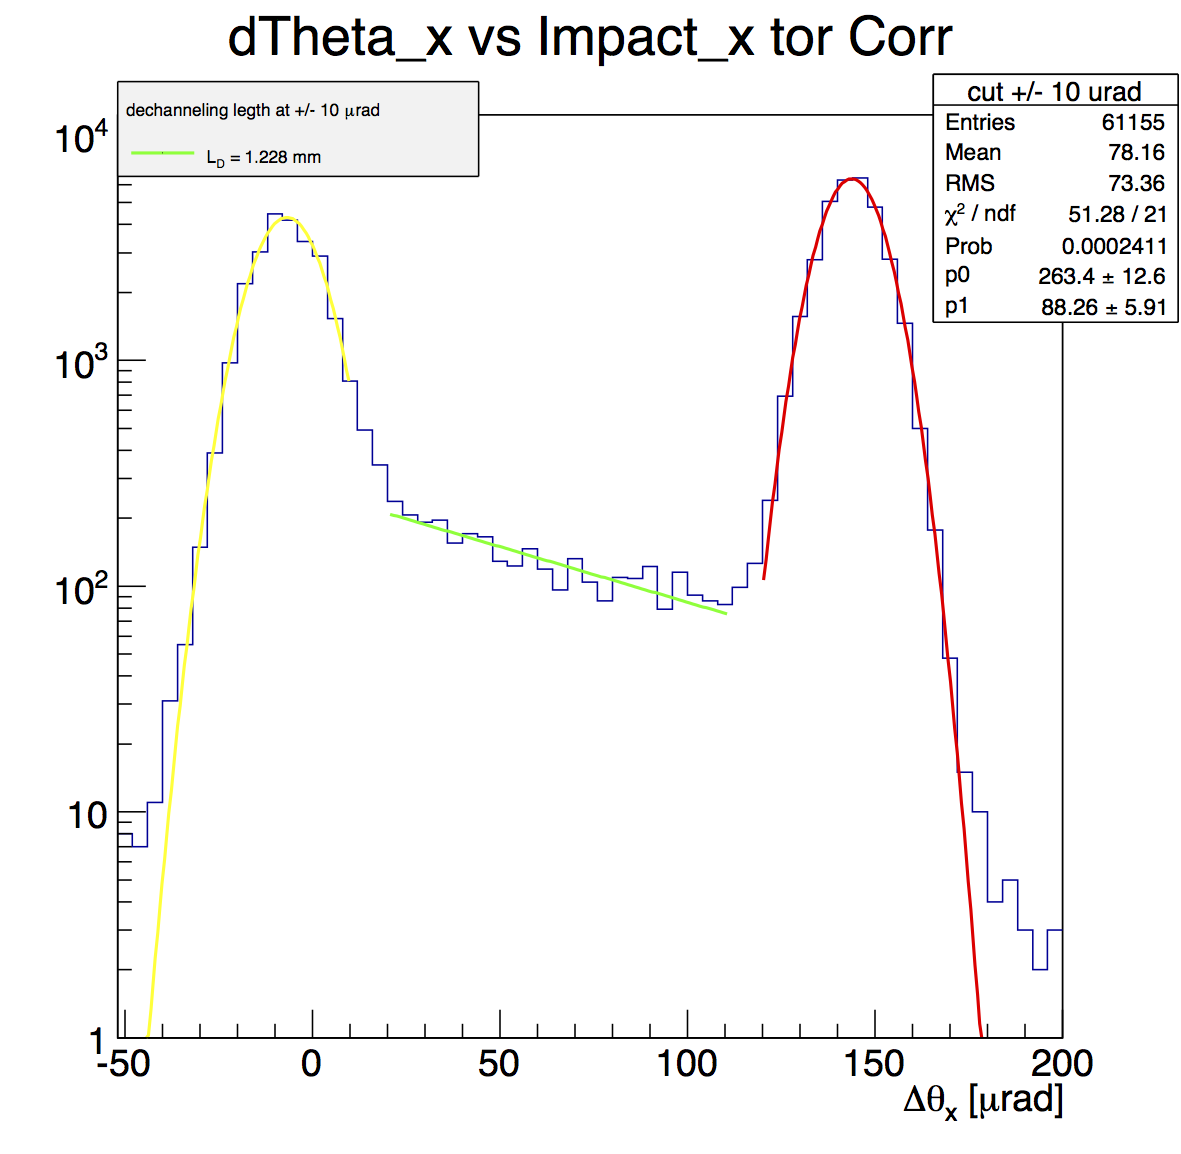
The dechanneling length (ld) is obtained from angular cuts at ± 5.0 μrad and at ± 10.0 μrad. After the cuts an exponential fit is performed between +3σ from the amorphous peak mean and -3σ from the channeling peak mean. The fit function is par[0]*exp(-x/par[1]), so the interesting parameter is par[1] which corresponds to an angle. The value of ld is calculated multiplying the curvature radius of the crystal by the parameter par[1]. The measured dechanneling length is 1.41 ± 0.14 mm and 1.28 ± 0.09 mm for the angular cut at ± 5.0 μrad and at ± 10.0 μrad, respectively.
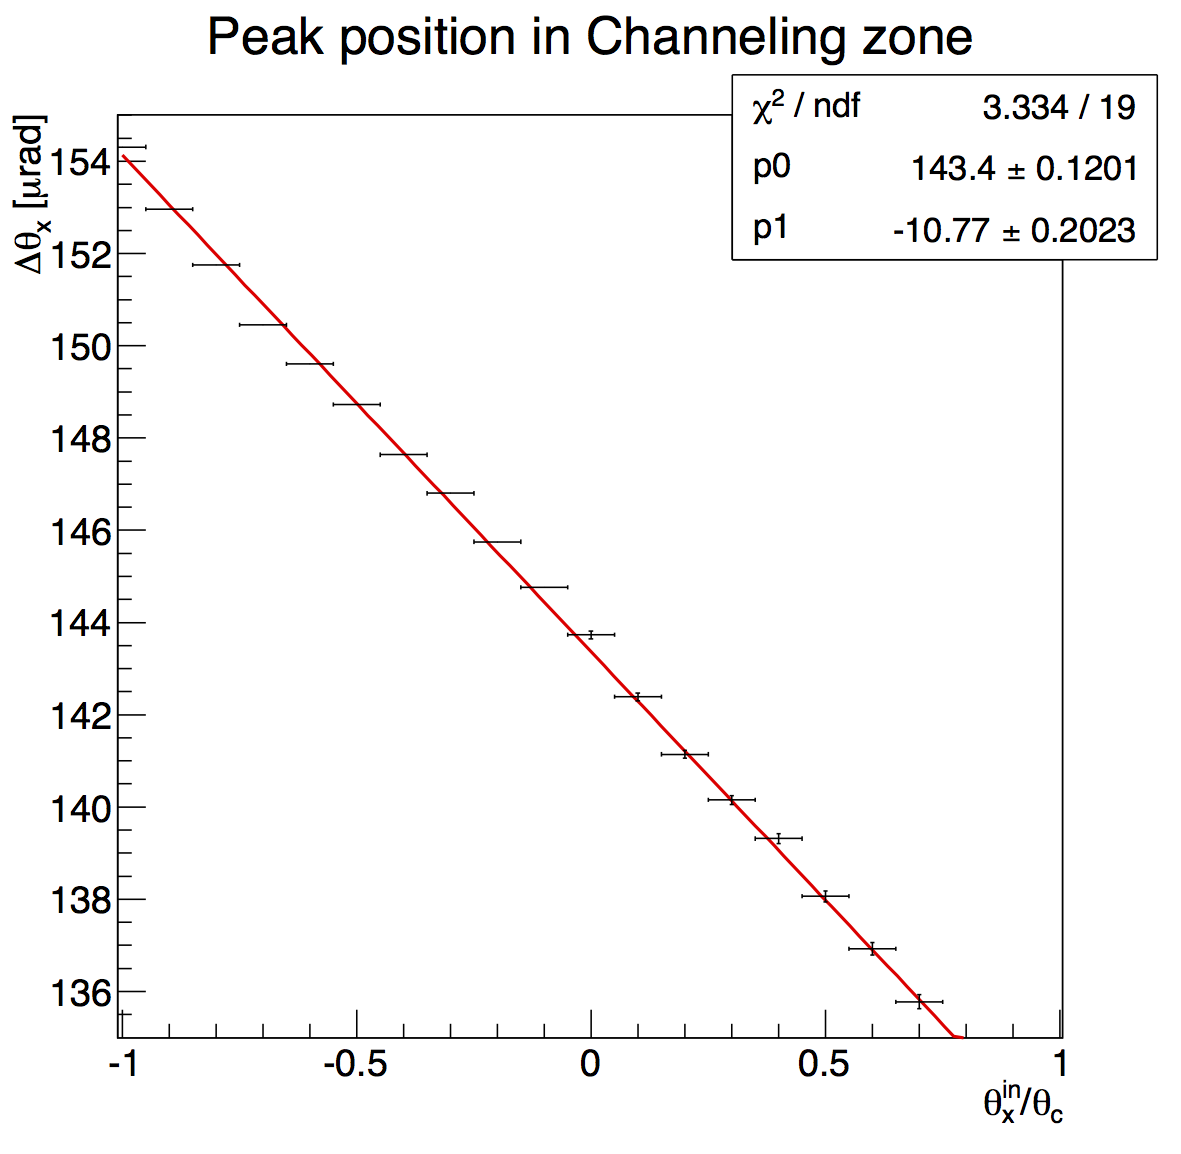
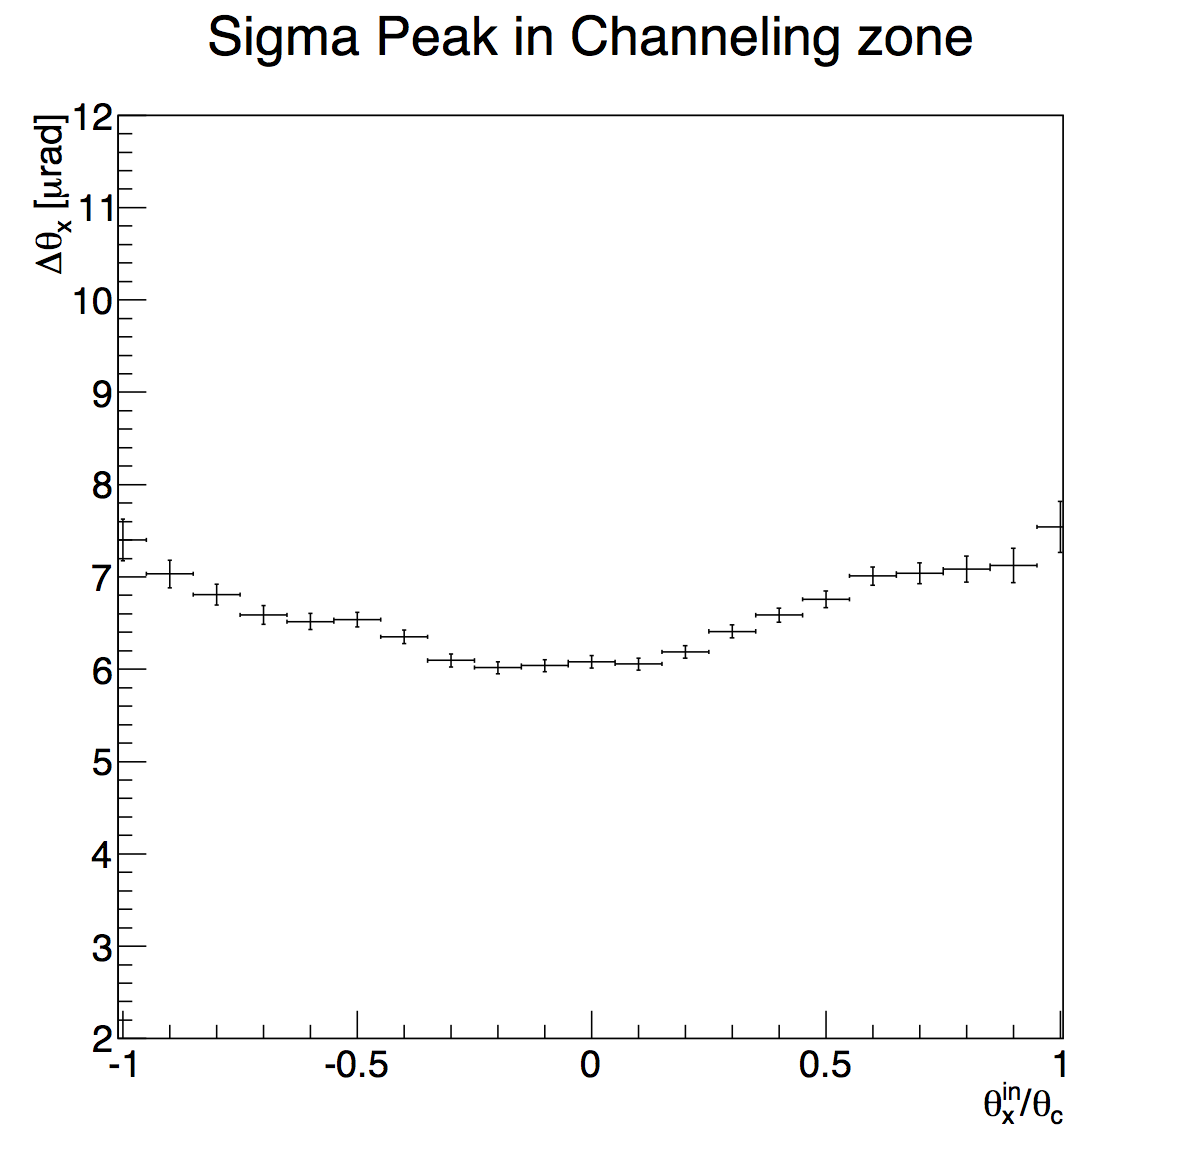
An analysis on the deflection peak position is performed in the channeling zone as a function of the impact angle. The region is within 3σ from the channeling gaussian mean measured from the deflection distribution (± 10 μrad cut on impact angle). Also distribution sigma trend of the same gaussian fit performed in the channeling region is shown.
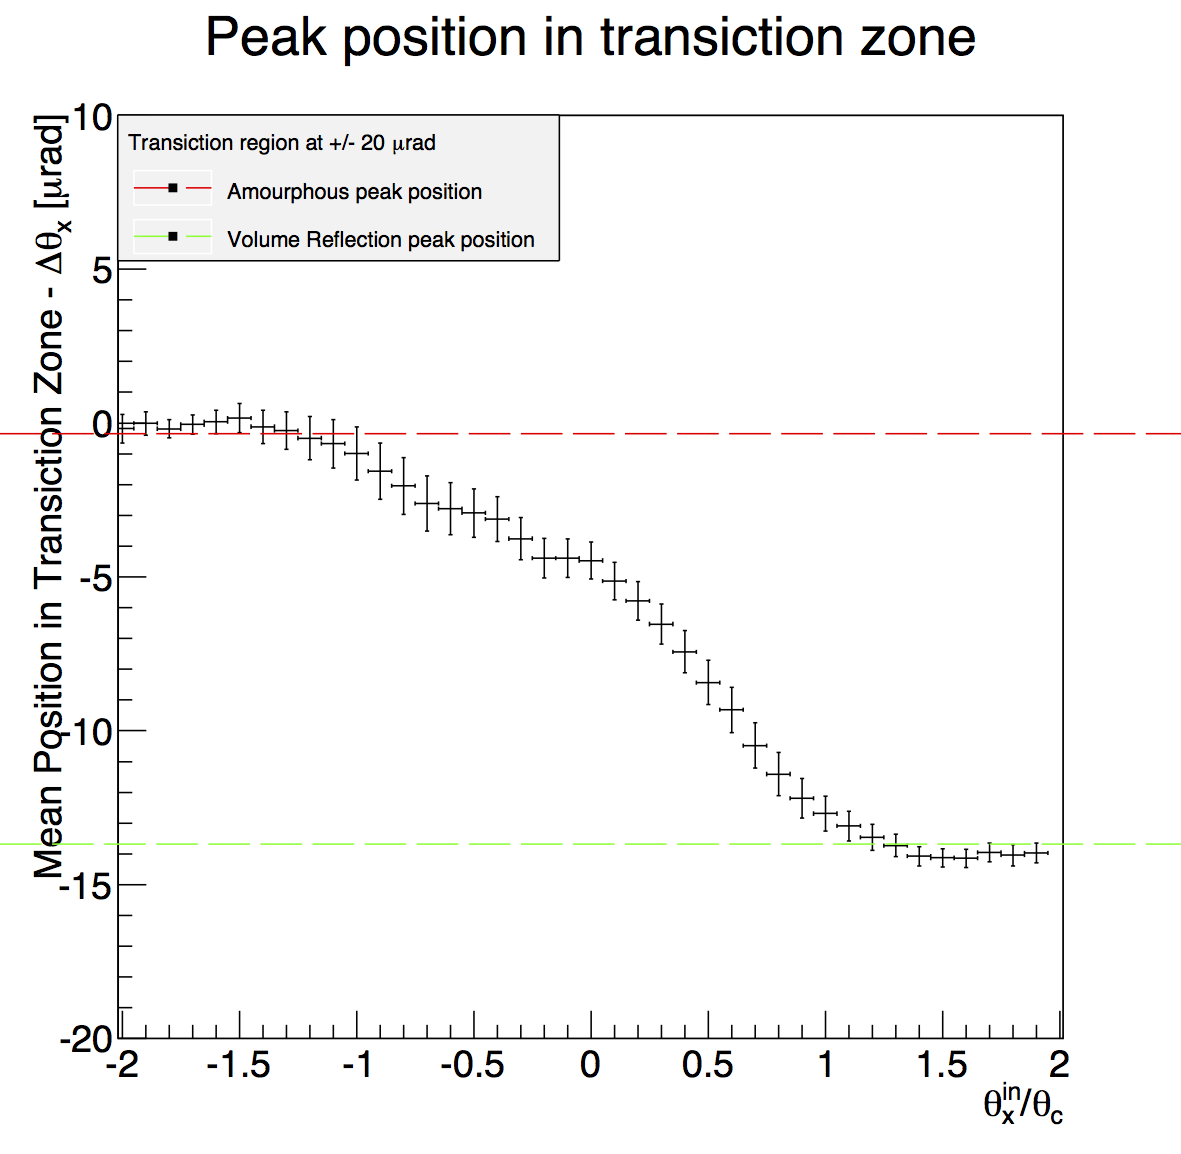
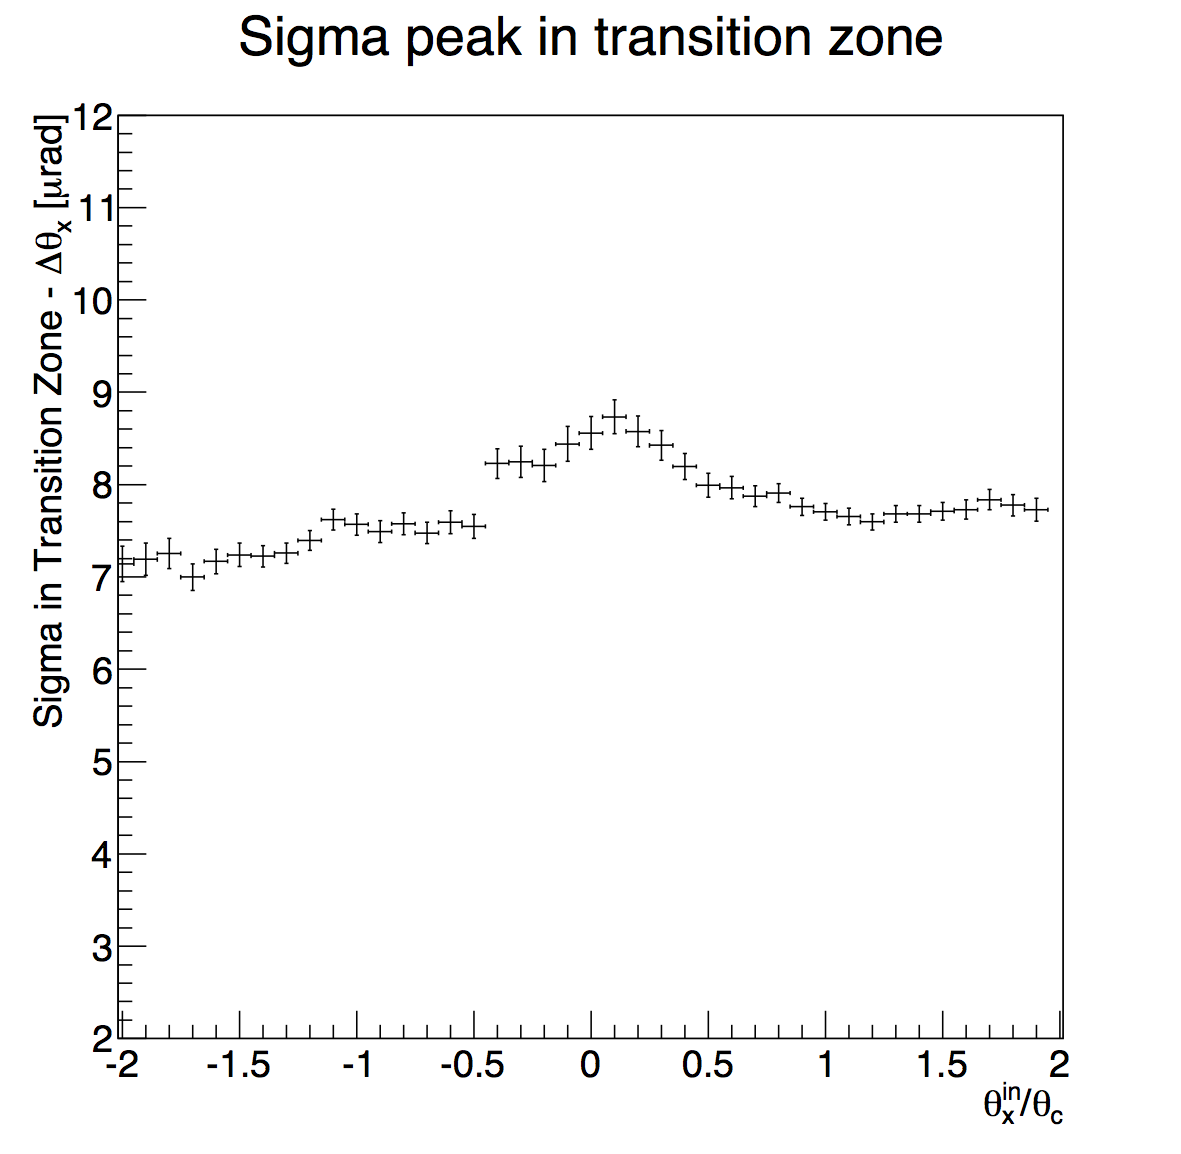
An analysis on the deflection peak position is performed in the transition zone between amorphous and volume reflection region as a function of the impact angle. The transition region goes from a deflection of -50 μrad to +20μrad. Also sigma trend of the same gaussian fit performed in the transition region is shown.
An analysis on the channeling and dechanneling region is performed as a function of the impact x angle. The populations are defined as the number of particles in the region of interest normalized to the total number of particles. The analysis is performed using a floating bin technique.
An analysis of the channeling region is performed showing different channeling efficiency as a function of the impact x angle. The channeling region is defined as the region between 3σ from the mean of the channeling peak. The ratio between the channeled particles and the total number of particles should be plotted as a function of the impact angle.
Also an analysis of the dechanneling population is performed in the angular range between +3σ from the amorphous peak mean and -3σ from the channeling peak mean. The dechanneling region is defined as the region between +3σ from the mean in the transition zone and -3σ from the mean of the channeling peak. The ratio between the dechanneled particles and the total number of particles should be plotted as a function of the impact angle.
We also present all the characteristics and the inputs for all the analyzed crystals.
In addition simulation code developers could create a summary table, for all crystals, with:
| Crystal | Bending angle [μrad] | Leght [mm] | Bending Radius [m] |
|---|---|---|---|
| STF38 | 211.23 ± 0.05 | 1.89 | 8.95 ± 0.01 |
| STF45 | 143.78 ± 0.07 | 2.00 | 13.91 ± 0.01 |
| STF47 | 34.10 ± 0.02 | 3.10 | 90.90 ± 0.06 |
| STF48 | 143.60 ± 0.02 | 2.00 | 13.89 ± 0.01 |
| STF49 | 246.65 ± 0.03 | 0.80 | 3.24 ± 0.01 |
| STF50 | 139.59 ± 0.01 | 2.00 | 14.33 ± 0.01 |
| STF51 | 33.40 ± 0.01 | 3.00 | 89.89 ± 0.03 |
| QMP27 | 108.13 ± 0.01 | 1.77 | 16.37 ± 0.01 |
| QMP29 | 33.95 ± 0.01 | 6.00 | 176.73 ± 0.02 |
| QMP32 | 170.69 ± 0.05 | 0.96 | 5.64 ± 0.01 |
| Crystal | Beam Profile [mm] | Beam Divergence [μrad] | ||||||
|---|---|---|---|---|---|---|---|---|
| μ_x | σ_x | μ_y | σ_y | μ'_x | σ'_x | μ'_y | σ'_y | |
| STF38 | -0.13 | 1.01 | 0.13 | 0.72 | 0.07 | 10.67 | 0.01 | 7.66 |
| STF45 | -0.16 | 1.00 | 0.14 | 0.72 | 0.15 | 10.68 | 0.02 | 7.70 |
| STF47 | -0.01 | 1.06 | 0.02 | 0.95 | -0.27 | 11.73 | 0.04 | 8.96 |
| STF48 | -0.01 | 1.05 | 0.01 | 0.96 | -0.08 | 11.88 | -0.07 | 8.98 |
| STF49 | 0.06 | 1.08 | 0.03 | 0.98 | 1.66 | 12.17 | -0.07 | 8.97 |
| STF50 | -0.19 | 1.29 | -0.01 | 0.86 | -0.91 | 10.90 | 0.36 | 8.05 |
| STF51 | -0.17 | 1.29 | -0.02 | 0.83 | 0.90 | 10.88 | 0.37 | 8.02 |
| QMP27 | -0.24 | 1.02 | 0.14 | 0.72 | 0.15 | 10.68 | 0.02 | 7.70 |
| QMP29 | -0.05 | 1.23 | 0.01 | 0.83 | -2.11 | 9.22 | 0.65 | 5.77 |
| QMP32 | -0.01 | 1.06 | 0.02 | 0.94 | -0.32 | 11.83 | -0.04 | 8.95 |